Thanks to its ease of use and wide application, gel permeation chromatography (GPC) has been a reliable and integral part of polymer development over the past few decades, providing molecular weight distribution data support for product performance development and control. Traditionally, gel permeation chromatography uses only a single refractive index (RI) detector to measure polymer concentration, but some GPC systems also offer a variety of detection methods including light scattering, viscosity, and ultraviolet. for selection. This raises the question: What are the potential benefits of using multiple detection methods? What are the advantages of this method of collecting multiple data sets?
In this article, Stephen Ball, Product Marketing Manager from Malvern Instruments' Nanoparticle and Molecular Characterization Division, will focus on the multi-detection GPC's contribution to the rapidly evolving polymer industry and highlight its strengths.
Analysis of Polymers by GPC Polymers vary in molecular chain length, short is only a few monomer repeats, long can be very long, but generally concentrated in a certain size range, making most commercial materials The molecular weight forms a distribution curve of a normal distribution or a Gaussian distribution. The shape and center point of the curve can be adjusted by controlling the process steps in production, primarily by changing the state of the polymer's polymerization temperature and reactant concentration.
It is important to control the average molecular weight and molecular weight distribution because these parameters affect various properties of the polymer, such as tensile strength, durability, flexibility, barrier properties, heat resistance, chemical resistance, and processability. GPC is an effective method to meet not only the relevant requirements for molecular weight distribution information, but also the entire process from the initial stage of polymer development to final product quality control.
We can think of the entire process of GPC as consisting of two relatively independent phases, namely sample separation and analysis of the different molecular weight fractions obtained after separation. The sample separation process is a prerequisite for GPC technology to measure different molecular weight fractions of the entire sample, but how much information each part can collect depends on which detector is selected and ultimately affects the efficiency of the experiment. In the past, it was common practice to measure the concentration of each part using a single refractive index (RI) detector (or UV detector), but the emergence of new detector technology has provided people with more data to gain a deeper understanding. Opportunity.
Single detection GPC
When using a single detector on a chromatographic system, a refractive index detector (RI) is typically used, and in some cases a UV detector is also used. Both the Rl data and the UV absorption spectrum reflect the polymer concentration reading, so the collected data results can be used to calculate the amount of eluted fraction in the original sample.
The retained volume is converted into a molecular weight by a calibration curve, and a molecular weight distribution curve is generated based on the concentration data. Running a set of known standards through the GPC system and recording their retention volume as a function of molecular weight produces a calibration curve that allows new sample data to be compared to form a new molecular weight distribution curve.
One of the important limitations of the above method is that it requires the sample to be very close to the structure or density of the standard. If this condition is not met, the resulting molecular weight distribution curve will be inaccurate. If it is to analyze a specific known polymer, it will not pose a big problem, because the appropriate standard is easy to find, the calibration method used is also known, and a moderately accurate estimate can be given. However, if it is not clear which set of standards to apply, the limitations of the calibration curve method become very obvious. The retention volume of different polymers is determined relative to the molecular chain structure of the polymer. If the standard used for calibration is not appropriate, then any relevant data will be affected - there may be more obvious substantial errors. However, the magnitude of the error may not be quantifiable.
The effects of these limitations on single detection of GPC are becoming more pronounced. Some precisely defined products such as "smart" materials and other high performance polymers that require a thorough understanding of their structure have not been characterized by a single detector. It's also important to note that the lack of proper standards is becoming more and more important, as the types and structures of polymers far outweigh those of traditional standards (such as polystyrene standards). Very well adapted test method.
Multi-detection GPC launch
Modern GPC systems typically feature three additional detectors based on the RI detector, including viscosity based detectors, light scattering detectors, and those capable of measuring in single or multiple UV wavelength ranges. These detectors provide disparate and complementary information that supports and complements each other to create a detailed picture of polymer performance and structure.
Viscometers can be used to collect various viscosity parameters, especially intrinsic viscosity (IV) that is inversely proportional to the molecular density of the polymer. During the measurement, the solution is pumped through the capillary bridge and the pressure difference between the capillaries is measured to generate an intrinsic viscosity value. The intrinsic viscosity is calculated from these data and volumetric flows using a standard equation for fluid flow, and then the final molecular weight can be measured using a technique called "universal calibration."
This way of determining the molecular weight of a viscometer overcomes the inaccuracy of experiments that rely on traditional calibration methods; however, at the same time,
Light scattering technology is also a powerful complementary technique for measuring molecular weight. The light scattering detector measures the molecular weight without estimation or inference, and independently generates absolute molecular weight and molecular weight distribution data without column calibration. When measured by a light scattering detector, the macromolecule is irradiated with a laser to measure the scattered optical density of the incident light in all directions. In the case where the solution concentration is known, the molecular weight of the macromolecule can be calculated directly from the recorded optical density data using the Zimm-Rayleigh-Debye equation.
The third and final type of commonly used detectors use ultraviolet spectroscopy to measure concentrations. Obviously, this method is only useful when the sample contains chemical and chemical bonds that are reactive with UV radiation, but it is true for many commercially valuable polymer materials. A simple UV detector can only detect one wavelength, so only one component concentration value can be provided in the eluted sample. On the other hand, a photodiode array (PDA) can simultaneously measure the absorbance at all wavelengths of ultraviolet light. The detector can therefore plot the changes in the macromolecular composition under consideration as a function of molecular weight.
These detectors all have their own advantages, but only in combination with each other can they fully meet the vast majority of testing requirements in today's polymer industry.
Maximize information flow with multi-detection GPC
Multi-detection GPC systems can be used for a variety of analytical or developmental applications of polymers, and are especially valuable for polymer development – ​​multi-detection methods maximize experimental efficiency and provide deeper understanding of polymer structure. The combination of different detectors offers different advantages, so optimizing the choice of detector is important.
For example, a viscometer can be used to generate a universal calibration curve for all polymer types (see Figure 2). Since the standard used in the universal calibration curve does not need to be consistent with the molecular structure of the unknown sample, this method is a significant improvement over the traditional calibration method using the RI detector alone. The universal calibration curve is unique to the GPC system, but not for specific polymers, once the curve is established, it will be applied to all polymers tested. This means that the molecular weight of any sample can be obtained by measuring IV and concentration without additional estimation.
The RI and IV methods form excellent complementarities, and the combination of the two methods greatly improves the drawbacks of the single RI assay. However, taking more methods to add more detectors will result in greater efficiency. Light scattering is used in the three detector system to achieve absolute molecular weight measurements without the need for any column calibration; it also provides an opportunity to obtain detailed molecular structure information.
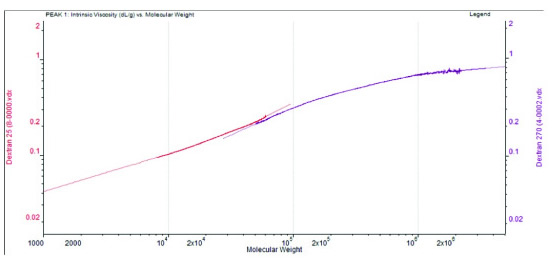
Molecular weight has the most significant effect on the properties of the polymer, but other parameters also have a strong influence on the behavior of the polymer. Determining structural features such as conformation, branching, and aggregation of polymers is critical to accurately characterizing internal structures that contribute to precise control of polymer performance. Figure 3 shows the Mark-Houwink curve generated using the three detector data, which gives structural information about the polymer. This curve highlights changes in polymer density as a function of molecular weight and can be used to capture important information related to structural characteristics of the polymer, such as the degree of branching and the rigidity of the molecular chain.
In the development of multi-component materials such as copolymers, the three-detection method can be further improved by adding a UV or PDA detector. They provide a clearer picture of the change in monomer content during polymer formation and as a function of monomer distribution and molecular weight in the finished material. This information provides further support to developers to fine-tune the polymerization to produce the best performing polymer materials.
Looking to the future
Applications that do not have a fixed standard are the biggest use for multi-detection of GPC, but in addition, the additional knowledge gained by this method of detection has great advantages for the development of any new polymer, ie, it can be The polymerization process used for the production of the material is optimized. Today, many polymer development projects can't rely on a single GPC approach.
Multi-detection, triple-detection or quad-detection GPC provides a comprehensive analytical approach to polymer structure and physical properties, which enables the industry to develop advanced polymers that will lead the industry to move forward and meet global sustainability and performance requirements. , is of vital importance.
Figure 1 : Viscosity detector.
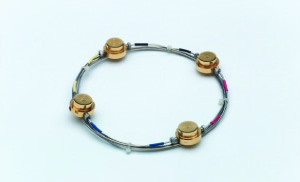
Figure 2 : Establishing a common calibration curve for a given GPC system means that the molecular weight of any polymer can be reliably determined by viscometer and RI data.
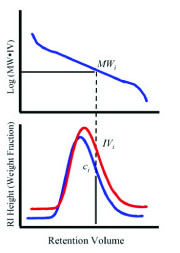
Figure 3 : The Mark-Houwink curve of intrinsic viscosity versus absolute molecular weight reveals structural information about the polymer and can be very useful in tailoring properties to polymers.
(Author: Stephen Ball, Malvern Instruments Nano particle and molecular characterization, Product Marketing Manager)
Swimming Crab,Frozen Blue Swimming Crab,Frozen Cut Swimming Crab,Box Frozen Swimming Crab
Zhoushan Haiwang Seafood Co., Ltd. , https://www.haiwangseafoods.com