Zhou Yue; Zhang Wei
Thermo Fisher Scientific (China) Co., Ltd.
Key words
QE HF; DDA; DIA; Hela; protein identification; quantitative proteomics
introduction
Data-independent acquisition (DIA) is a new method of mass spectrometry data acquisition developed in recent years [1]. Its philosophy is to perform relative/absolute quantification of proteins with secondary fragment ions. In the DIA scan mode, ultra-high resolution mass spectrometry fragments all precursor ions in a specific mass range, collects fragment ions of all parent ions, and rapidly scans all fragment ions in the adjacent parent ion wide port in sequence. DIA's data contains retention time and intensity information for all fragment ions. The peptides can be identified and quantified by objectively extracting multiple daughter ions of the same peptide with a very small mass deviation wide mouth (eg, 10 ppm) and calculating the intensity of the daughter ions. DIA quantification has better selectivity and accurate quantification than traditional DDA based on parental ion intensity [1], so DIA has become a new development direction of quantitative proteomics.
Q Exactive HF is a new electrostatic field orbitrap ultra-high resolution mass spectrometer introduced by Thermo Fisher Scientific at ASMS 2014 (Figure 1) [2,3]. Q Exactive HF uses Advanced Quadrupole Technology (AQT) to increase ion transmission efficiency by at least 2x; Ultra High Field Orbitrap technology improves Orbitrap scanning speed at 15000 resolution The scan speed of the graph is 20 Hz. These two technologies improve QE HF's ability to collect DDA and DIA data. In this paper, the DDA identification ability and DIA quantitative ability of QE HF were examined using a 1-hour fast chromatographic gradient, and the DDA quantification and DIA quantification ability were compared from the quantitative peptide number and CV.
Experimental condition
Experimental materials and methods
Pierce HeLa Protein Digest Standard (Cat. No. 88329), diluted to 500 ng/μl, EASY-nLC injection 1 μl, 500 ng for DDA, DIA data acquisition, each acquisition pattern was repeated 3 times.
High performance liquid chromatography
High Performance Liquid Chromatograph: EASY-nLC 1000 (Thermo ScientificTM)
Analytical column: laboratory-made C18, 15 cm, ID 75 μm, 3 μm
Mobile phase: A: 0.1% aqueous formic acid; B: 0.1% formic acid acetonitrile solution
Gradient: 60 min, 3/0 – 6/2 – 22/48 – 40/53 – 80/55 – 80/60 (%B/min)
Flow rate: 300 nL/min
Mass Spectrometry
DDA data collection:
Mass spectrometer: Q Exactive HF (Thermo ScientificTM);
Ion source: NanoFlex ion source; ion mode: positive ion;
Spray voltage: 1.8 kV; capillary temperature: 275 ° C; S-Lens RF: 55%;
Resolution: Level 120,000@m/z 200, Level 15000@m/z 200; Level 1 AGC: 3e6, Maximum IT: 50ms;
Collision energy: NCE 27%; Fixed first mass: 110 m/z
DIA data collection:
Mass spectrometer: Q Exactive HF (Thermo ScientificTM);
Ion source: NanoFlex ion source; ion mode: positive ion;
Spray voltage: 1.8 kV; capillary temperature: 275 ° C; S-Lens RF: 55%;
Target m/z window: 400–1000; isolation window: 12Da;
Collision energy: 27%; fixed first mass: 200 m/z; AGC target: 1e6;
Maximum ion injection time: atuo;loop count: 50
data processing
Proteome Discoverer Protein Identification Process: Human Protein Database (uniprot human_201309), Parent Ion Mass Deviation: 10 ppm; Fragment Ion Mass
Deviation: 0.02 Da; fixed modification: cysteine ​​alkylation (+57.021 Da); dynamic modification: methionine oxidation (+15.995 Da); asparagine and glutamine deamination (+0.984 Da) ; enzyme: trypsin; missed site: 2; FDR < 0.01
Skyline DDA, DIA protein quantification process: DDA quantification using the skyline MS1 filtering function, extracting the three parent ion isotope peaks with the highest intensity of each peptide, idotp _ 0.8; DIA quantification using the skyline DIA function, setting the isolation window 12 Da Peak extraction was performed on the 5 daughter ions with the highest intensity of the peptide, mProphet was scored, and FDR < 0.01 was controlled.
Experimental result
1.DIA data collection and analysis process
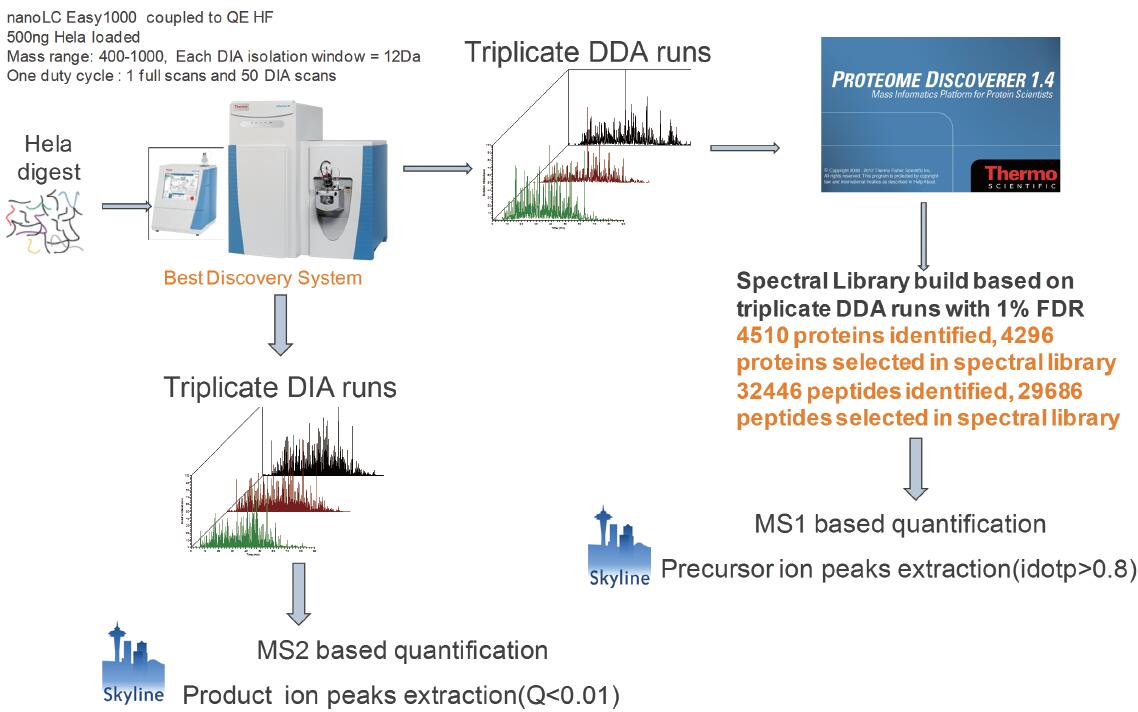
Figure 1. DDA quantification and DIA quantification protocol
500 ng Hela cell lysates were subjected to 3 1 h gradient DDA analysis and Proteome Discoverer 1.4 database search. The identified protein and peptide information was imported into the skyline as candidate quantitative proteins and peptides. Parent ion-based quantification uses the MS1 filtering function in the skyline to perform parent ion intensity extraction on DDA data. 500 ng Hela cell lysate was subjected to 3 target m/z windows 400–1000, and the DIA analysis of the isolation window 12 Da. Based on the quantification of secondary ion, peak extraction was performed on the daughter ion using the skyline DIA function, mProphet was scored, and the peptide with Q value < 0.01 was selected as the quantitative peptide.
Before analyzing the DIA data, a spectral library needs to be built. The spectrum library contains the peptides identified by all proteins in the mass spectrum, as well as the retention time of the peptides, the fragment ion mass-to-charge ratio, and the fragment ion intensity. Data-dependent scanning is the best way to build a data collection method for a spectral library. Three DDA data were collected from 500 ng of Hela cell lysate. Raw data is retrieved by Proteome Discoverer and controls FDR < 1%. Combine the three DDA identification results and import them into the skyline to create a spectrum library. In addition to giving identification information for proteins and peptides, DDA data can also be quantified based on the intensity/peak area of ​​the parent ion. The MS1 filtering function in Skyline extracts multiple isotopic peaks of the parent ion and scores according to the isotope distribution (idotp value) [4]. Idotp represents the similarity between the measured isotope distribution and the theoretical isotope distribution. A parent ion with an idotp value greater than 0.8 was screened as a reliable quantitative peptide.
500 ng Hela Cell Lysate Use the same column and the same chromatographic gradient to switch QE HF to DIA scan mode for 3 DIA data acquisitions. In one scan cycle, the target parent ion nucleus ratio range is 400–1000, and the quadrupole isolation window is 12 Da, containing 50 MS/MS scans. Each MS/MS spectrum contains fragment ion information for all parent ions in a 12 Da window. The QE HF uses an ultra-high field Orbitrap with a scan speed of 20 Hz, so each cycle takes about 2.4–3 s and is compatible with the chromatogram (Figure 2). When Skyline processes DIA data, the highest intensity fragment ions are selected from the spectral library for chromatographic peak extraction. The mProphet software embedded in Skyline scores based on the features of multiple ion peaks of the same peptide. Feature includes sub-ion co-elution peak shape, retention time deviation, dotp value, signal-to-noise ratio, and so on. To distinguish false-positive daughter ion peaks, mProphet can create a decoy library, or you can use the second-ranked peptide as a decoy to calculate FDR [5,6]. Peptide segments with FDR < 0.01 were screened as authentic quantitative peptides (Figure 1).
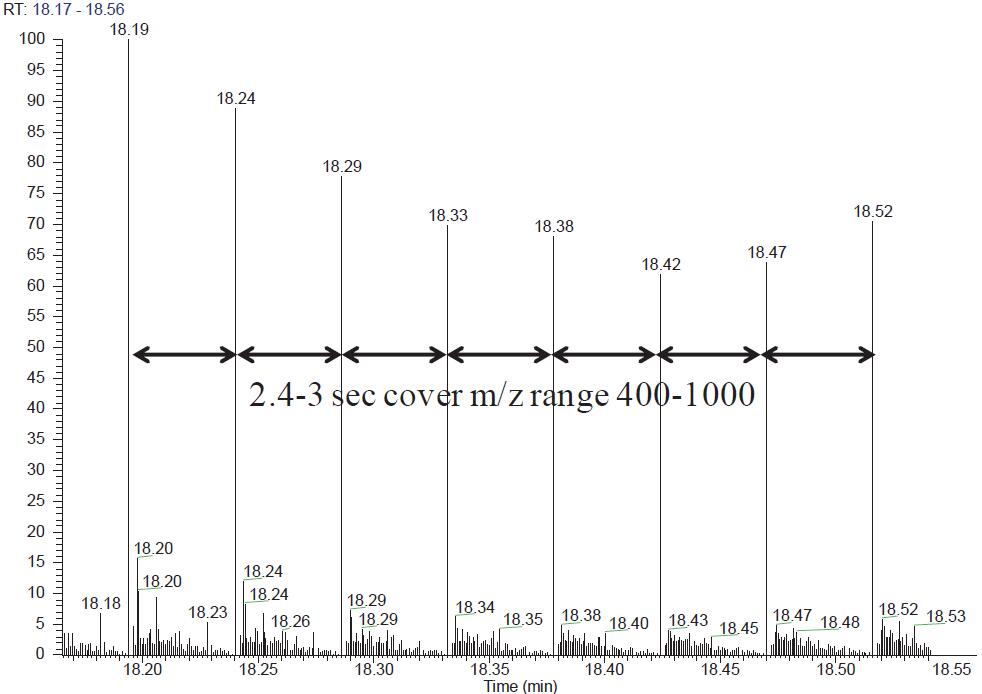
Figure 2. QE HF scan target mass-to-core ratio window 400–1000 The time required to acquire 50 MS/MS is 2.4–3 s
2. DDA identification results and spectral library creation
500 ng Hela cells were subjected to DDA data acquisition with a 60 min chromatographic gradient. In 60 min, three repetitions, QE HF collected 49,065,490,31,48,885 spectra, identified 22030, 21820, 21654 peptides, corresponding to about 3909, 3900, 3878 proteins. The peptides and proteins were combined three times, and a total of 32,446 peptides and 4510 proteins were identified (Fig. 3). Protein and peptide identification results were imported into the skyline to create a spectral library. Through the spectrum library, candidate peptides and proteins to be quantified are established in the skyline. In order to improve the accuracy of protein quantification, some peptide restriction conditions are set in the skyline, m/z 400–1000, parent ion charge 2+–4+, no missing cleavage site. There were 29,686 peptides in 32446 peptides that met these conditions, corresponding to 4296 proteins. In the DDA quantification experiment, the three highest isotope peaks (M, M+1, M+2) with the highest intensity were added as quantitative ions for each candidate peptide, and a total of 89,027 quantitative ions were generated. In the DIA quantitative experiment, five of the most intense product ions (b3-bn, y3-yn) were added to each peptide, resulting in a total of 145,736 quantitative ions.
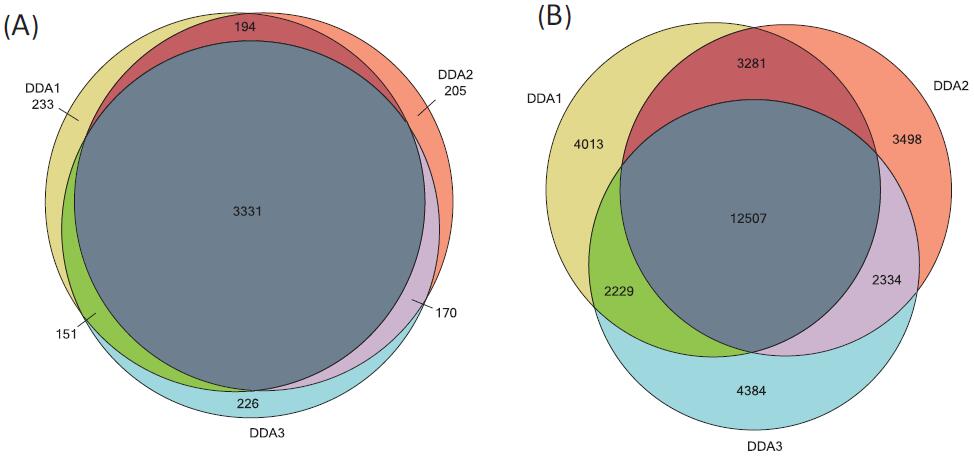
Figure 3. Three DDA identification results for 500 ng Hela cell lysate (A) A cross-sectional map of the peptides identified by the protein overlay (B) identified.
3. Comparison of DDA quantification based on parent ion and DIA quantitative results based on daughter ion
For DDA quantification, the skyline will extract the parent ion isotope peak from the DDA data first-order spectrum. The peptides with well-distributed isotope distribution and theoretical isotope distribution were screened as reliable quantitative peptides, ie idotp > 0.8. Since the same chromatographic gradient was used in the DDA and DIA experiments, the retention time information of the peptides in the DDA experiment can be passed to the DIA experiment. Therefore, when DIA is quantified, the skyline is limited to extract only the product ions in the peptide library for a retention time of 5 min. Retention time limits can reduce the complexity of DIA data processing and increase the accuracy of quantitation. At the same time, the most reliable quantitative peptides of the peptide with Q value < 0.01 were screened.
The three DDA experiments quantified 25214, 25515, and 24873 peptides from the first-order spectrum; 3969, 3975, and 3917 proteins; the quantified peptides accounted for 84% of the total candidate peptides; and the peak area had a CV of 20 The following accounted for 58.81% of the total quantitative peptides; 25.5% of the CV values ​​below 10% (Fig. 4). Three DIA quantifications were quantified to 27558, 27604, and 27483 peptides; 4067, 4080, and 4073 proteins, respectively. 93% of the total peptide candidate peptides were quantified; the peak area had a CV value of less than 20% of the total quantitative peptides of 90.3%; and the CV value of less than 10% accounted for 69.01% (Fig. 5). It can be seen that DIA is able to quantify more peptides, and the peak area CV value of the quantitative peptide is much smaller than DDA.
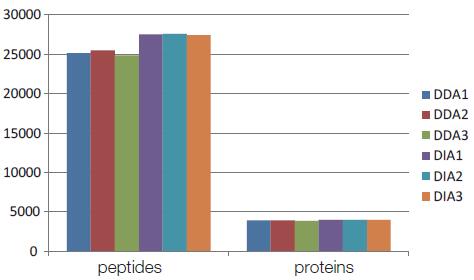
Figure 4. Peptides and proteins quantified by 3 DDA experiments and 3 DIA experiments
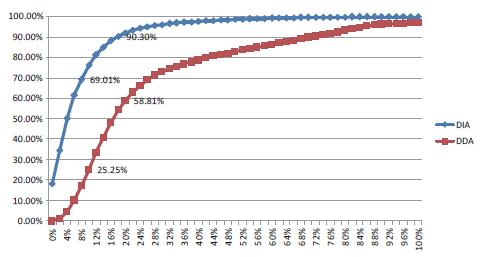
Figure 5. DDA quantification and DIA quantification of parent and daughter ion peak areas CV
in conclusion
DDA is generally used for protein/peptide identification and can be quantified based on parent ions. In very complex matrices, it is very susceptible to interference by other peptides, resulting in inaccurate quantification and excessive CV values. DIA quantification is based on the quantification of secondary ion ions. Quantification with sub-ion ions increases the selectivity of quantification and reduces the interference of other peptides. The quantification is more accurate than the quantification based on the first-order peak area, and the CV value is small. In this experiment, DDA quantification and DIA quantification ability were evaluated using 500 ng Hela cell lysate. Three DDA experiments identified 32,446 peptides and 4510 proteins. The identified proteins and peptides were imported into the skyline to create a spectral library, and 4296 candidate quantitative proteins and 29686 candidate quantitative peptides were screened as a common quantitative target for DDA and DIA. DDA quantifies 84% ​​of the peptide, 92% of the protein; DIA quantifies 93% of the peptide, 95% of the protein. DIA can quantify more peptides and proteins than DDA, while the CV of the DIA quantitide peak area is much smaller than the CV of the DDA quantitative parent ion peak area. The results indicate that the quantification based on the secondary ion is due to the quantification based on the primary parent ion.
QE HF identifies and quantifies 4000 proteins from 500 ng of Hela cell lysate in a one-hour gradient, thanks to QE HF's better ion transport efficiency and ultra-fast scanning speed. At present, DIA quantitative based on one-dimensional reversed-mass spectrometry is not suitable for two-dimensional chromatography-mass spectrometry. However, it is possible to increase the separation efficiency to achieve full coverage of the cellular proteome by extending the gradient of the one-dimensional reversed phase chromatography. In 2014, the Matthais Mann team used a one-dimensional reversed-phase chromatogram gradient of mouse NSC-34 and N2a cell lysates for 240 min to identify more than 8,000 proteins, essentially reaching the full coverage of the cell line protein group [7]. The identification of peptide proteins by DDA and the establishment of a spectral library, DIA protein quantification may become a new development direction of quantitative proteomics.
references
1. Gillet, L C. et al. Targeted data extraction of the MS/MS spectra generated by data-independent acquisition: a new concept for consistent and accurate proteome analysis. Mol Cell Proteomics, 2012, 11(6): O111 016717.
2. Kelstrup, C D. et al. Rapid and deep proteomes by faster sequencing on a benchtop quadrupole ultra-high-field orbitrap mass spectrometer. J Proteome Res, 2014, 13(12): 6187-6195.
3. Scheltema R A. et al. The Q Exactive HF, a benchtop mass spectrometer with a pre-filter, high performance quadrupole and an ultra-high field orbitrap analyzer. Mol Cell Proteomics, 2014, 13(12):3698-3708
4. Abbatiello S E. et al. Design, implementation, and multi-site evaluation of a system suitability protocol for the quantitative assessment of instrument performance in LC-MRM-MS. Mol Cell Proteomics, 2013, 12(9):2623- 2639
5. Reiter, L. et al. mProphet: automated data processing and statistical validation for large-scale SRM experiments. Nat. Methods.2011,8 (5):430-435
6. Röst H L. et al. OpenSWATH capable automated, targeted analysis of data-independent acquisition MS-data. Nat. Biotechnol. 2014, 32(3): 219-223
7. Horburg D. et al. Deep Proteomic Evaluation of Primary and Cell Line Motoneuron Disease Models Delineates Major Differences in Neuronal Characteristics. Mol Cell Proteomics, 2014, 13(12):3410-3420
Gun Safe,Gun Cabinet Safe,Gun Safe Cabinet,Storage Gun Safe Box
Hebei Hupai Aodi Cabinet Industry Co.,Ltd. , https://www.hupaiaodi.com